
Research Nigerian stocks on evidence, not rumours.
NGX-listed companies scored 0–100 every trading day on value, quality and momentum — ranked against its own sector, filtered for liquidity and explained in plain English.
Measured daily, published in full
Every figure on this page is calculated from our data at the close on Friday 23 October 2026.
Why investing on the NGX is hard
Most investors rely on tips, gut feel and incomplete information. On a market where many stocks rarely trade, that is an expensive way to learn.
Tips, rumours and story stocks
WhatsApp groups and market chatter push stocks with a good story, not good numbers. By the time a tip reaches you, the price usually has too.
Prices you can’t actually trade
Many NGX stocks trade a handful of times a week. A cheap-looking price means little if you can’t buy — or sell — without moving it.
Scattered, unreliable data
Prices, results and corporate actions are spread across exchange PDFs, broker sheets and news sites — and feeds carry errors that quietly distort every ratio.
A disciplined process, every trading day
MoloneyStreetRe gives you the scores, the research and the context to make decisions on evidence, not emotion.
See where every stock stands
Stop buying stories — start with the evidence
Each stock gets one score from 0 to 100, built from three pillars and ranked against its own sector. The score sets its tier, so you can see the whole market at a glance.
- Every NGX stock tracked — 125 fully scored today
- Value 40% · Quality 35% · Momentum 25% — plus Growth and Dividend profile scores
- Banks against banks, telcos against telcos
- Illiquid stocks are flagged, never ranked
Research a stock in minutes
Everything in one place you can trust
No more jumping between exchange PDFs, broker sheets and news sites. Each company has one page with its score history, pillars, peers, price chart and risk flags.
- 127 stock research pages
- A screener with 30 filters across the whole market
- Daily and weekly trading data with market demand
- Compare, watchlists and price alerts
Learn the method, follow the market
Context from people who invest this way
A short brief after every session, a research note every Friday and a full education hub — so you understand why a stock scores the way it does, not just what it scores.
- Daily market brief after every session
- Weekly research note every Friday — 20 published so far
- 110 education guides, beginner to advanced
- Updates on Telegram, X, LinkedIn and YouTube
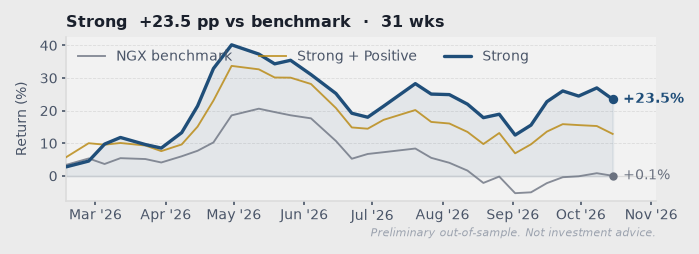
Published, not polished
Every week the model’s top-tier stocks form an equal-weighted basket. Here is how that basket has done against the whole market — wins and losses included, recalculated every night.
Share of stocks that rose over the next four weeks
By the tier the model gave them on the day — 11,105 observations.
Higher tiers have risen more often — the order the model is built to produce. Backtest from 16 Feb 2026 to 15 Oct 2026; equal weights, before dealing costs. A short history: treat it as directional evidence, not a promise. Past performance is not a reliable indicator of future results.
See the full track record →Everything you need to invest with discipline
One subscription, the whole NGX — start free and upgrade when you’re ready.
MSRe Scores
NGX stocks scored 0–100 on value, quality and momentum, against their own sector.
Stock screener
Filter the whole market on 30 measures — scores, ratios, liquidity, dividends.
Stock research pages
One page per company: score history, pillars, peers, price chart and risk flags.
Trading data
Daily and weekly NGX trading tables, market demand and order-book depth.
Signals & track record
Daily model signals, with every past signal and its outcome tracked in the open. Free accounts see a preview.
Dividend hub
Upcoming dividends, yields, payment history and dividend calendars.
Daily market brief
What moved, why, and what the model changed — every trading day.
Education hub
From first share to portfolio construction, written for the NGX.
Deep dives
Long-form analysis of companies, sectors and investing ideas.
ETF Centre
Nigerian and global ETFs with costs, holdings and performance.
FGN Savings Bond
Monthly rates, offer windows and a calculator for the FGN bond.
Frontier hub
The FTSE Frontier constituents from Nigeria, scored and tracked.
Fresh off the press
New every trading day. Read a full note before you sign up.
Research engineered like an institution — built for the individual investor.
MoloneyStreetRe began as one investor’s system for researching Nigerian stocks from abroad: the same rules, applied the same way, every day. That system now runs every evening for every subscriber.
Every measure is ranked within the stock’s own sector, so a bank is never judged by a telco’s yardstick.
A stock has to trade before it is ranked — a bargain you can’t buy or sell isn’t one.
The track record is published in full, losses included, with the caveats on the chart — not in the small print.
Frequently asked questions
Who is MoloneyStreetRe for?
Investors in Nigerian equities who want evidence rather than tips — individuals at home and in the diaspora, family offices and advisers. You don’t need to be a professional: every page explains what the numbers mean, and the education hub starts from the basics.
How often is the data updated?
Every NGX trading day. Prices, scores, signals and pages are rebuilt each evening after the market closes, and a research note is published every Friday.
Is this investment advice?
No. MoloneyStreetRe publishes research and education. Tiers and scores are the output of a quantitative model applied to public data — not personal recommendations. Check liquidity, prices and your own circumstances before you trade.
What is behind the score?
Three pillars — Value (40%), Quality (35%) and Momentum (25%) — each measure ranked against companies in the same sector, so banks are compared with banks. Stocks that trade too rarely get no tier. Today 4 stocks score 72 or more.
How reliable is the track record?
It covers 31 weekly rebalances since February 2026 and is recalculated every night, losses included. That is enough to show the tiers rank stocks in the right order, not enough to prove a long-run edge — we say so on every chart.
What do I get for free?
The homepage and pricing page are open to everyone. A free account adds the daily brief, the education hub, a signals preview, dividends, disclosures, the ETF Centre, the Frontier hub, weekly note and deep-dive previews, and price alerts. Premium unlocks scores, the screener, stock pages, trading data, watchlists, the full signals list and track record, the full weekly note and deep dives.
Start making NGX decisions on evidence.
Here’s what you get
- Know where stocks stand with a daily 0–100 score and tier
- Research a company in minutes, not hours, on one page
- Avoid liquidity traps — illiquid stocks are flagged, never ranked
- Follow the market with a daily brief and a Friday research note
- Learn the method through 110 education guides